Evergreens
Line graphs
Example:
Assume that every student in Example 1
visits exactly 2 courses, but nobody visits the same two.
Assume students know each other if and only
if they attend some common course.
All students are asked who knows whom.
Is it possible to reconstruct all attendance lists?
Graphs occuring in this way are called line graphs.
More precisely, the line graph
L(G) of a graph G=(V,E)
has the edge set E as vertex set, and two such
former edges are adjacent in L(G)
whenever they share a common vertex in G.
Thus it is the intersection graph of G,
if edges are viewed as 2-element subsets of the vertex set.
Line graphs appeared implicitely in a 1932 paper of
H. Whitney
and were explicitely introduced by
J. Krausz in 1943.
From the beginning, the question whether and how line graphs
G can be recognized, and how so-called roots
H---graphs for which L(H)=G holds--- may look like
for line graphs G was central in the
investigation of line graphs.
Whitney showed that every connected graph except K3
has at most one root (K3 has two roots:
K1,3 and K3).
Krausz gave in his paper a
characterization of line graphs,
which, however, didn't lead to an
efficient recognition algorithm.
But such algorithms follow from characterizations of line graphs in
[RW65],
[B67], see
[L74],
[R73], for instance.
Thus the question in the Example
above can be answered
in the affirmative.
If the knowledge graph of the students is connected,
and if there are at least 4 students, then we may find
out all attendence lists in polynomial time,
and these lists are unique
(modulo relabeling of the courses---of course we don't know
the names of the courses).
Interval graphs
Example:
The mathematics department has a small cafeteria,
so small, indeed that it is impossible to oversee
anybody who is there at the same time.
Anybody claims to have been there only once,
but 8 meals have been eaten by 7 people,
so somebody must have been there twice.
The investigator asks everybody whom he or she saw
at the cafeteria, and the result is
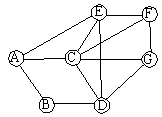
the graph on the right. Who is the overeater?
(This is a shortened version of examples by
Berge and
Golumbic. )
|
 |
An interval graph is an intersection graph of
a family of intervals of the real line.
These graphs have been introduced by
G. Hajos in 1957.
They got some kind of fame, however, after the molecular biologist
R. Benzer tested in 1961 the hypothesis that the subelements
of genes are linearly linked together in the following way:
Under the mutations, he identified 32 so-called
deletions---mutations caused by the loss of a
connected DNA fragment. By recombination tests, it is
possible
to decide whether deletions overlap or not.
The resulting graph was, as should be the case, an interval graph.
One year later, Lekkerkerker and Boland gave two `good'
characterizations of interval graphs,
and nowadays several efficient recognition algorithms exist.
Line graphs and interval graphs behave well
The classes of line graphs and interval graphs are both
algorithmically relatively tame:
Membership in both classes can be recognized in polynomial time,
furthermore
many optimization problems that are NP-hard
for general graphs are polynomial-time solvable when
restricting the input to interval or line graphs.
It seems that many researchers, when facing new,
apparently difficult, problems, routinely try line graphs
and interval graphs.
This, and the prominence of interval graphs and line graphs
seduced some people to take the opinion
that problems for intersection graphs should always be
relatively easy to tackle.
In my opinion, this is far from being true,
see
here,
here,
here, and
here, for example.
Back to the
start page for intersection graphs.
Erich Prisner
made on January 12, 1999
